Published: Sep 16, 2020 by Shuai Zhou
GPS2space is an open-source Python library for:
- Compiling spatial data from raw GPS lat/long coordinates
- Constructing Buffer- and Convex hull-based activity space and shared space at different time scales
- Speeding up nearest distance query using cKDTree method (currently only support Point-Point nearest distance query)
See documentation for more information
Load libraries
%matplotlib inline

import pandas as pd
import geopandas as gpd
import matplotlib.pyplot as plt

from gps2space import geodf
from gps2space import space
Load data
df = pd.read_csv('../data/example.csv')
gdf = geodf.df_to_gdf(df, x='longitude', y='latitude')
Construct person-time
gdf['timestamp'] = pd.to_datetime(gdf['timestamp'], infer_datetime_format=True)
gdf['week'] = gdf['timestamp'].dt.week

gdf['person_week'] = gdf['pid'].astype(str) + '_' + gdf['week'].astype(str)
gdf.head()
| pid | timestamp | latitude | longitude | geometry | week | person_week | |
|---|---|---|---|---|---|---|---|
| 0 | P2 | 2020-04-27 10:42:22.162176000 | 40.993799 | -76.669419 | POINT (-76.66942 40.99380) | 18 | P2_18 |
| 1 | P2 | 2020-06-02 01:12:45.308505600 | 39.946904 | -78.926234 | POINT (-78.92623 39.94690) | 23 | P2_23 |
| 2 | P2 | 2020-05-08 23:47:33.718185600 | 41.237403 | -79.252317 | POINT (-79.25232 41.23740) | 19 | P2_19 |
| 3 | P2 | 2020-04-26 14:31:12.100310400 | 41.991390 | -77.467769 | POINT (-77.46777 41.99139) | 17 | P2_17 |
| 4 | P2 | 2020-03-31 15:53:27.777897600 | 41.492674 | -76.542921 | POINT (-76.54292 41.49267) | 14 | P2_14 |
Calculate convex hull-based activity space
convex_space = space.convex_space(gdf, group='person_week', proj=2163)
convex_space.head()
| person_week | geometry | convx_area | |
|---|---|---|---|
| 0 | P1_1 | POLYGON ((-79.08352 40.61927, -78.64613 41.031... | 0.459119 |
| 1 | P1_10 | POLYGON ((-77.29803 39.81326, -78.33096 41.824... | 2.980511 |
| 2 | P1_11 | POINT (-80.05021 41.60526) | 0.000000 |
| 3 | P1_12 | LINESTRING (-78.86727 41.79762, -75.39833 40.5... | 0.000000 |
| 4 | P1_13 | POLYGON ((-79.36647 39.99230, -77.46196 41.851... | 1.425932 |
Check P1 and P2 at week 10
p1_w10 = convex_space[convex_space['person_week']=='P1_10']
p2_w10 = convex_space[convex_space['person_week']=='P2_10']
share = gpd.overlay(p1_w10, p2_w10, how='intersection')
ax = p1_w10.boundary.plot(edgecolor='green')
p2_w10.boundary.plot(ax=ax,edgecolor='black')
share.plot(ax=ax)
plt.show();
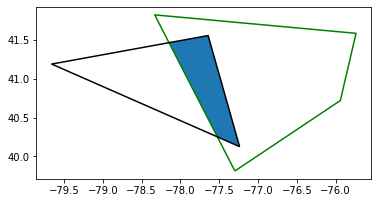
As shown in the figure:
- The enclosed green line is the activity space for P1 at week 10
- The enclosed black line is the activity space for P2 at week 10
- The blue area is the shared space for P1 and P2 at week 10